- 2023-02-27
Gold Price Forecast: US Dollar dominance keeps weighing on XAU/USD
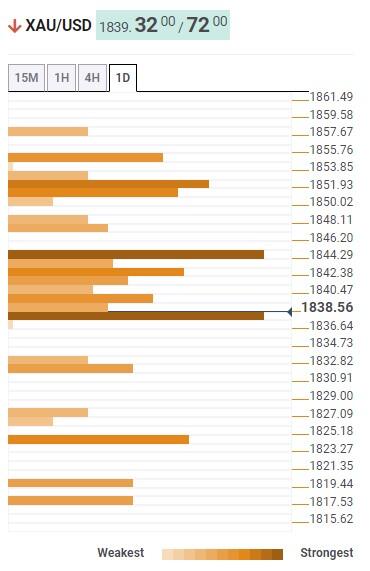
Gold price stays in bearish mode, approaching $1,800 psychological support. US Dollar stays dominant across the board as US macroeconomic data keeps beating expectations. ISM Manufacturing and Services PMI releases headline a mid-tier economic data week. Gold price has opened the week quietly, treading waters above the round $1,800 figure, which is providing immediate support. The bright metal lost value to the US Dollar on all five trading days last week, seeing its biggest sell-off on Friday after the US Personal Consumption Expenditures (PCE) inflation release, the Feds preferred indicator, clearly beating expectations. This week, a bunch of mid-tier United States macroeconomic releases could help shape how much more room Gold price can have to the downside ahead of the crucial March 22 Federal Reserve (Fed) meeting. The US central bank probably will take all the data into account before delivering its next monetary policy plan – the now famously known as dot plot – although next two weeks with Nonfarm Payrolls and Consumer Price Index should be more impactful. Gold news: Consumer Confidence more relevant than Durable Goods Orders The US Census Bureau will release the Durable Goods Orders data for January at 13:30 GMT. Since the beginning of February, upbeat macroeconomic data releases from the United States have been supporting the US Dollar, and a similar market reaction could be expected this time. Nevertheless, this data by itself is unlikely to impact the Federal Reserves policy outlook in a significant way. On Tuesday, the Conference Boards Consumer Confidence Survey for February (scheduled for 15 GMT) will be scrutinized for more direction. Rather than the headline Consumer Confidence Index, the one-year consumer inflation expectations could trigger a reaction. In January, this component of the survey climbed to 6.8% from 6.6% in December. In case there is a pullback in this figure, the US Dollar could lose interest and help Gold price stage a short-term recovery and vice versa. United States Manufacturing and Services PMIs on the way The ISM will publish the Manufacturing PMI and the Services PMI on Wednesday and Friday, respectively, both at 15 GMT. If the ISM Services PMI report reaffirms that rising wage costs are feeding into accelerating price pressures in the sector, the US Dollar is likely to hold its ground against Gold. Hence, the Prices Paid Index component will be watched closely by market participants. Its worth noting, however, that the CME Group FedWatch Tool shows that markets are fully pricing in at least two more 25 basis points Federal Reserve rate hikes in March and May. Additionally, the probability of the Fed holding the policy rate unchanged in June stands at 25%. The market positioning suggests that the US Dollar doesnt have a lot of room on the upside, at least until the February jobs report and inflation data confirm or refute one more 25-bps hike in June. In the meantime, investors will be watching the US Treasury bond yields. 4% aligns as key resistance for the 10-year US T-bond yield and there could be a technical correction if that level stays intact. In that scenario, Gold price could turn north due to the inverse correlation with the US Treasury yields. Gold price developing more bearish patterns Dhwani Mehta, Senior Analyst at FXStreet, analyzes Gold price current bearish trend: Gold price is maintaining its downtrend while within a falling wedge formation since peaking at $1,960 on February 2.” “XAU/USD is likely to test the falling trendline support at $1,794 after it breached several crucial demand area last week. At that level, the bullish 100-Daily Moving Average (DMA) coincides. Ahead of that level, the $1,800 level will likely offer stiff resistance to Gold sellers. Gold price in 2023: Up-and-down action Financial markets have been a two-tale story for the early part of 2023, in which Gold price has reflected in its price action like no other asset. XAU/USD rode an uptrend during all of January with the market optimism about inflation slowing down and constant Federal Reserve dovish talk, only to see a drastic turnaround back to the old dynamics in February after a hot US Nonfarm Payrolls (NFP) report. The US economy adding more than 500K jobs in the month of January shifted the market expectations for the Fed easing its monetary policy, and the US Dollar has come back to the market King throne. Gold price daily chart in 2023, downtrend after peaking at $1,950 Gold price opened the year at $1,823.76 and reached a year-to-date high of $1,960 on February 2, right in between the first Federal Reserve meeting of the year and the surprising release of the US jobs report for January. Since then, the ongoing downtrend has been relentless, reaching levels below the yearly open, around $1,800.


.jpg)
.jpg)

.jpg)
.jpg)